in vivo / in vitro correlation
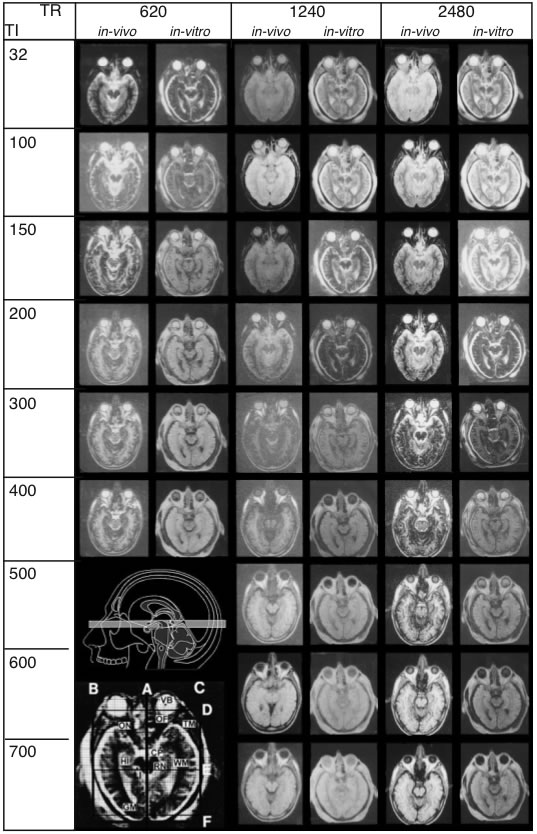
In autopsy brains, relaxation times, signal-to-noise ratio, and contrast are altered due to absence of flow effect, cessation of metabolism and fixation procedures. In order to perform comparison analysis between living and postmortem tissue, parameters that influence signal intensity were measured under both in vivo and in vitro conditions. For such a correlation, the heads of two volunteers and of two cadaver heads were scanned. The parameters of the IR and SE sequences and corresponding images of one image plane are shown in Fig. 1.
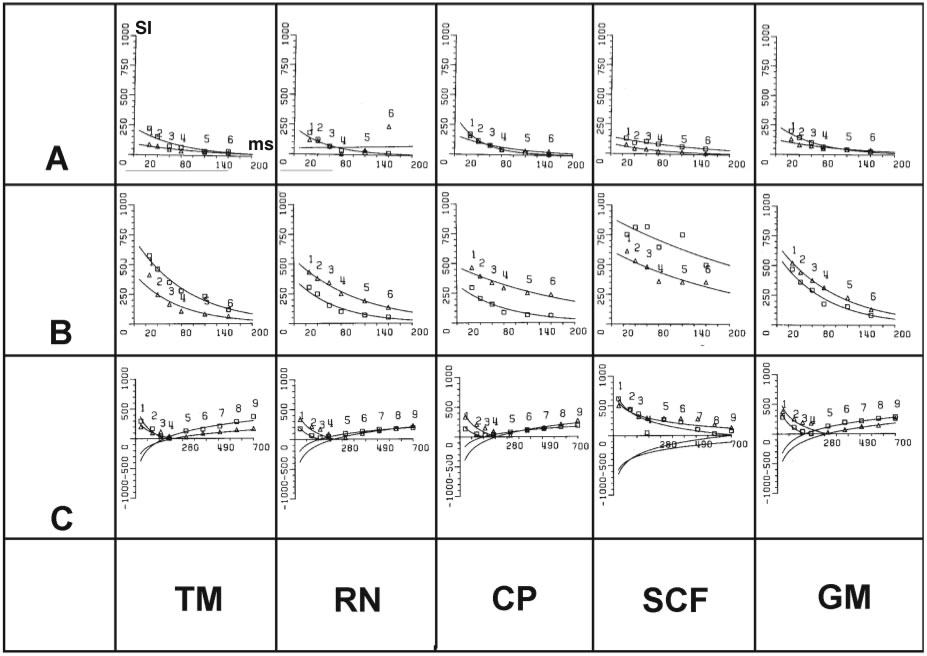
Examples of regression curves of in vivo/in vitro measurements of signal intensities are shown in Figs. 2. and Fig. 3. T1 (Spin-lattice) relaxation, T2 (spinspin) relaxation, and N(H) (proton density) of the in vivo/in vitro tissues are represented in Fig. 4.
Compared with the in vivo results the in vitro tissues show
- large, nonlinear reduction in T1 relaxation times and N(H) values,
- small (neglegible) changes in T2 relaxation times, and
- increased contrast (in IR images highly dependent onextrinsic parameters, TI, TR).
A stable correlation between the variations seen under in vitro conditions and the in vivo relaxation curves exists.
The different grayscale values determined from the same in vivo and in vitro structures can be explained by biophysical alterations of the different fractions of water ("three fraction model", Grösch and Noack, 1976) by temperature, formalin fixation, additives to the fixative solution, and duration of tissue fixation (see Longerich, 1989).
These results show that the MR images of formalin-fixed cadaver heads not only are helpful in correlating in vitro tissues to the in vivo situation by means of structural gradients and contrast, but also can be used for image interpretation on a quantitative basis. Estimation of the signal changes after formalin fixation may thereby aid characterization of human brain tissue by MRI before it is laminated and neuropathologically evaluated. Moreover, the addition of paramagnetic substances or shift reagents into the perfusion fluid can increase the regional contrast and demarcate areal boundaries that are not evident in regularly performed scans. Prussian blue, for example, has been found to increase the signal in basal ganglia structures.
Figures
Figure 1 – A
Sequence parameters used for in vivo/in vitro
correlation. Measurements shown were taken from a
25-year-old volunteer (in vivo) and from a cadaver head
(in vitro). A: TR (repetition time) and TI (spin-lattice relaxation) times for IR sequences
 times for SE sequences. MR images obtai ned under in vivo and in vitroconditions exhibit striking differences. Upper inset (A) shows the plane of sectioning. The lower inset shows every scan overlayed with a grid (A-F) to secure precise location of the same regions of interest throughout the series. (Abbreviations: CP: cerebral peduncle, GM: gray substance), Hi: hippocampus, Li: cerebrospinal fluid, OF: orbital fat, ON: optic nerve, RN: red nucleus, TM: temporalis muscle, VB: vitreous body, WM: white matter.")
Figure 1 – B
TR and TE (spin-spin relaxation) times for SE sequences. MR images obtai
ned under in vivo and in vitroconditions exhibit striking
differences. Upper inset (A) shows the plane of sectioning. The lower inset shows every scan overlayed with
a grid (A-F) to secure precise location of the same regions of interest throughout the series. (Abbreviations:
CP: cerebral peduncle, GM: gray substance), Hi: hippocampus, Li: cerebrospinal fluid, OF: orbital fat, ON: optic
nerve, RN: red nucleus, TM: temporalis muscle, VB: vitreous body, WM: white matter.
 and in
vitro(open squares) signal intensity measurements from 10 different tissues that show dependency of signal intensity (as gray values, Y-axis) from TE (spin-echo sequences, A, B) and TI (inversion recovery sequences, C) at constant TR A: 200 ms, B:
5000 ms, C: 2500 ms).")
Figure 2
Regression curves of in vivo (open triangles) and in
vitro(open squares) signal intensity measurements from 10 different tissues that show dependency of signal intensity (as gray values, Y-axis) from TE (spin-echo sequences, A, B) and TI (inversion recovery sequences, C) at constant TR A: 200 ms, B:
5000 ms, C: 2500 ms). T1 and T2 relaxation times are calculated from these curves. Regions of interest: 1: white matter, 2: hippocampus, 3: optic nerve, 4: orbital fat, 5: vitreous body, 6: temporalis muscle, 7: red nucleus, 8: cerebral peduncle, 9:
cerebrospinal fluid, 10: gray matter.
 Comparison between in vivo (A) and in vitro(B)
signal intensity (SI) measurements using IR sequences with different T1 (50 - 700 ms) at constant TR (5000 ms) for the follo-
wing tissues: 1: vitreous body, 2: orbital fat, 3: optic nerve, 4:
hippocampus, 5: white matter, 6: gray substance, 7: cerebral
peduncle, 8: red nucleus, 9: temporalis muscle.")
Figure 3
(A, B) Comparison between in vivo (A) and in vitro(B)
signal intensity (SI) measurements using IR sequences with different T1 (50 - 700 ms) at constant TR (5000 ms) for the following tissues: 1: vitreous body, 2: orbital fat, 3: optic nerve, 4:
hippocampus, 5: white matter, 6: gray substance, 7: cerebral
peduncle, 8: red nucleus, 9: temporalis muscle. (C-F)
Registration similar to (A) and (B) showing the ranges of signal
intensities for tissues with short and long T1 (C,D) and T2 (E,F)
relaxation under in vivo(C,E) and in vitro(D,F) conditions.

T1 (spin-lattice relaxation, A) and T2 (spin-spin relaxation, B)
values (in ms) determined for the following regions of interest:
VB: vitreous body; OF: orbital fat; ON: optic nerve; HI: hippo-
campus; WM: white matter; GM: gray matter, CP: cerebral
peduncle; RN: red nucleus; TM: temporalis muscle, CSF: cere-
brospinal fluid.")
Figure 4
Comparison between in vivoand in vitrotissues (A,B)
T1 (spin-lattice relaxation, A) and T2 (spin-spin relaxation, B)
values (in ms) determined for the following regions of interest:
VB: vitreous body; OF: orbital fat; ON: optic nerve; HI: hippo-
campus; WM: white matter; GM: gray matter, CP: cerebral
peduncle; RN: red nucleus; TM: temporalis muscle, CSF: cere-
brospinal fluid. (C) Relation between in vitroN(H) relativ to in
vivoN(H) (in %) for the regions of interest. Abbreviations:IR-
Seq.: T1 (spin-lattice relaxation), SE-Seq.: T2 (spin-spin relaxa-
tion). (Data from Longerich, 1989).

